Studying social sentiments of people from different work fields over time using quotes
Context
A quote is not just text, not just sentences. It is the process of using words to express an idea, thoughts, a message, an explanation and much more. If it is possible to just focus on those aspects, we must not forget that there is a mind behind a quote, a human being that lived, saw or reflected about a subject, a situation that may be its own. Over the years, the humanity experienced many terrible events like wars, economic crisis or more recently pandemics for example.
People change over time, or at least the way they feel, think and express themselves, and this is what will interest us today. By focusing on the background of the mind behind a quote, we want to study and see its sentiment in general or during a specific event. Is someone’s expressed sentiment directly related to its occupation, what it is going through ? Those are questions we aim to answer, focusing on the speaker as well as the words he or she used.
Sentiment analysis
This project articulates around sentiment analysis. In order to observe any evolution, changes or to the contrary, a certain stability of the emotional state of the society, we will here work with quotes, from Quotebank and in order to give them a score, we will use the VaderSentiment as sentiment analysis tool, despite specifically attuned to sentiments expressed in social media, it turned out to be one of the best scoring model among the ones we tested.
Our pipeline for this is really simple, we first process the quote and then apply the sentiment analyzer provided by Vader and focus on the returned scores. This allow us to get metrics for each quote that we will use in order to study the sentiment, mental state in the next sections !
Dates
Let’s dive into the temporal aspect of our story and begin with a simple but important notion, the distribution of the quotes over time :
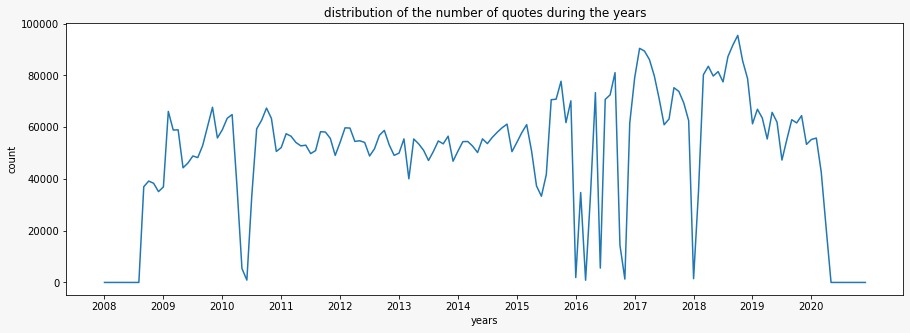
Overall, we do not see any weird behavior over time in the numbers of quotes, expect in some years like 2016 where sudden drops happen, which can come from the data used, and thus we will have to be very carefull when working with such periods in the following experiments. Also, we note that the first and last years (2008 and 2020) are not fully covered over the data, which is not a problem by itself but may lack some precision about some events.
Now, what about the main aspect that interest us, which is the sentiment. In order to have a first touch about this, we observed the score of the quotes month by month over the years :
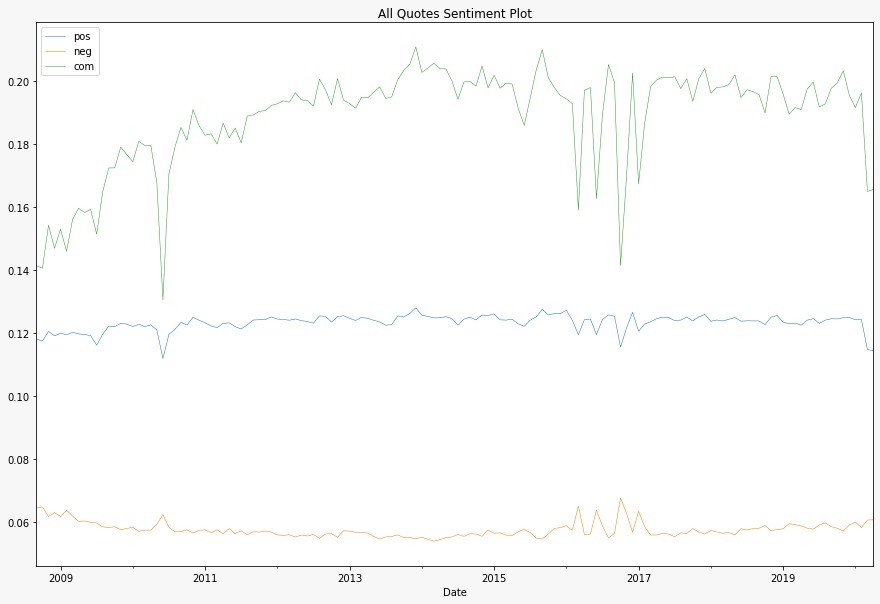
We observe 3 lines, in green representing the compound score (the most useful metric if you want a single unidimensional measure of sentiment for a given sentence), in blue the positivity and in yellow, the negativity. Note that we do not show the neutrality score, as it is mostly the highest score overall for all quotes, and thus is not useful to observe any relevant shift in the global sentiment.
Some huge variations that we can notice in the metrics happen closely to the drops seen in the distributions of the quotes. This is the case in 2010 and 2016, but it doesn’t seem to have such an impact in 2018. Again, we have to keep this in mind, since a lower quote distribution implies a greater noise at those particular periods and could be responsible for the spikes in the sentiment scores. Before going further, let’s take a closer look at 2016 :
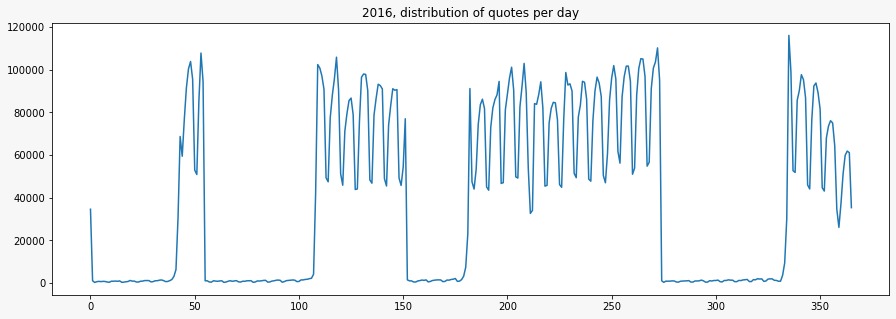
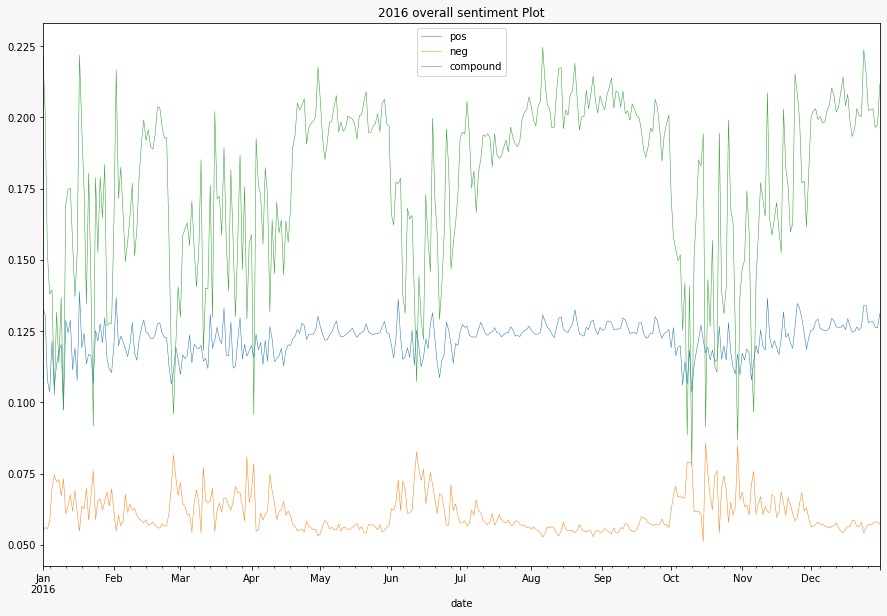
As expected, due to the low amount of quotes, we can not observe a clear trend during this year. The huge variations in the sentiments are probably mostly due to the noise induced by the lack of data. Between these “quotes canyons” however, the more stables periods are fine to work with, which is great !
Overall, when looking at all the years, we have a nice baseline to work with before shifting our focus on the people behind the quotes, and more precisely, their occupations.
Occupations
Here, let’s begin by explaining briefly what we did in order to study the professions. Due to the huge number of occupations, we decided to group them depending on the “domain” they are related (medicine, military, etc…). To do this, we first used a clustering method to get a kind of pre-grouping and then, we do a kind of manual check by re-attributing a job to another cluster that we define to contain only one domain based on selected wordlist related to a certain type of work.
More formally, the initial clustering helped us to group some of the occupations together but unfortunately, since no “ecology” or “economy” cluster seemed to stand out, we had to “help” the clustering a little bit by providing a wordlist that would then look, in all the clusters that didn’t make sense, for the jobs and their description in order to reclassify them together.
Here is the histogram of the number of occurences of the occupations among all the speakers per cluster :
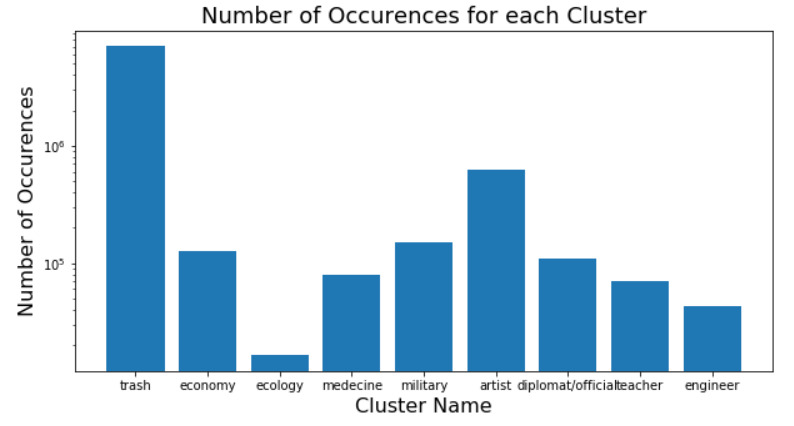
Obviously, the “trash” cluster contains the highest number of occurences of jobs we do not focus on, among all the existing domains of professions. Amidst all the speakers, there seem to be a huge amount of them that are artists, or who works in an artistic field, while there are very few people having a background related to ecology. In general, the other clusters look to be of more or less the same sizes.
Now that can focus our analysis over a particular domain of occupations, let’s observe how a particular profession may impact the sentiment of a speaker !
Impact of events
In this section, we aim to answer the following question : Can we correlate the sentiment scores variations of different speakers’ professions such as medical workers, finance workers, and climate activists with historical events such as pandemics, the subprime crisis, or disasters ?
Let’s begin with the environmental domain :
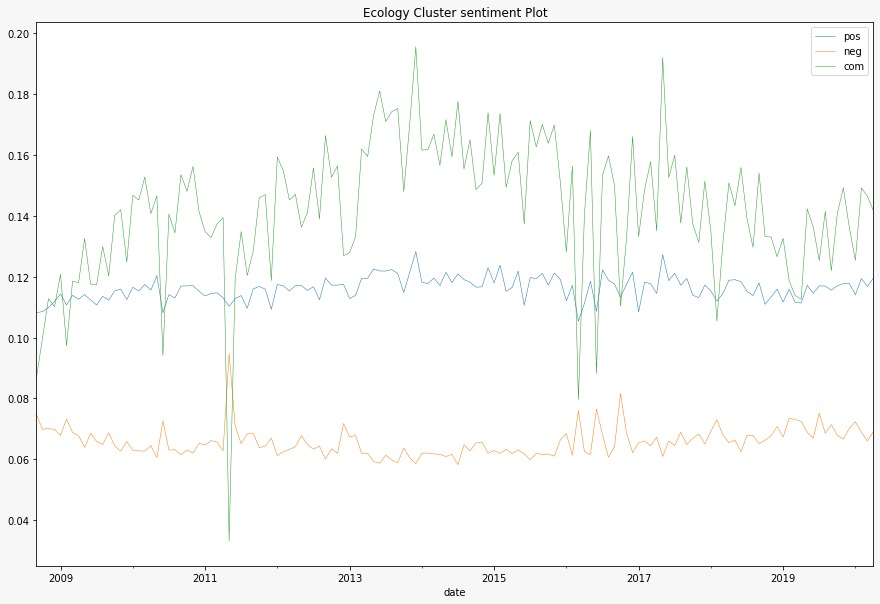
If there is one thing that directly stands out this plot, it’s the huge spike of negativity in early 2011. This could be explained by the sadly famous disaster of Fukushima that happened the 11th of march. Speakers working in the field of ecology could have really been touched by this event and thus express more the negativity they felt.
Can something similiar be seen for medical workers ?
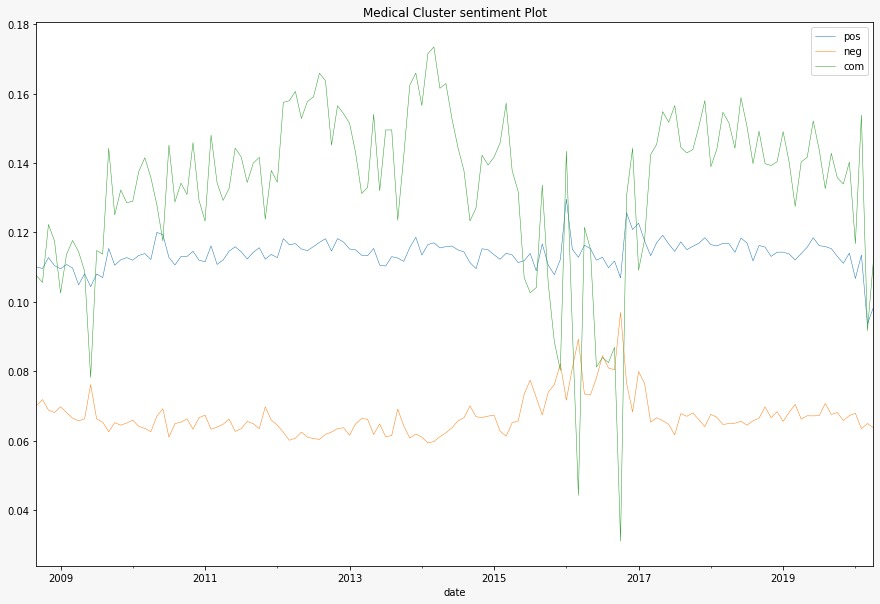
We observe 2 main drifts from the genral trend of the compound, in early 2009 and the other in 2016. The first one could be explained by the apparition of the H1N1 virus that started in april 2009. As it became a pandemic, the overall negativity of speakers from the medical domain increased. We could compare this with the drop of positivity happening in the end of 2019, early 2020, with the still ongoing covid pandemic, but unfortunately we do not have enough data to observe a clear shift in the trend.
Now for 2016, as we already studied this particular year, those spikes are not significative due to the huge variance implied by the lack of data in the “quotes canyons”. Thus, we have to be careful if we want to draw any conlusions from this observation.
Now, let’s focus on another cluster, the military :
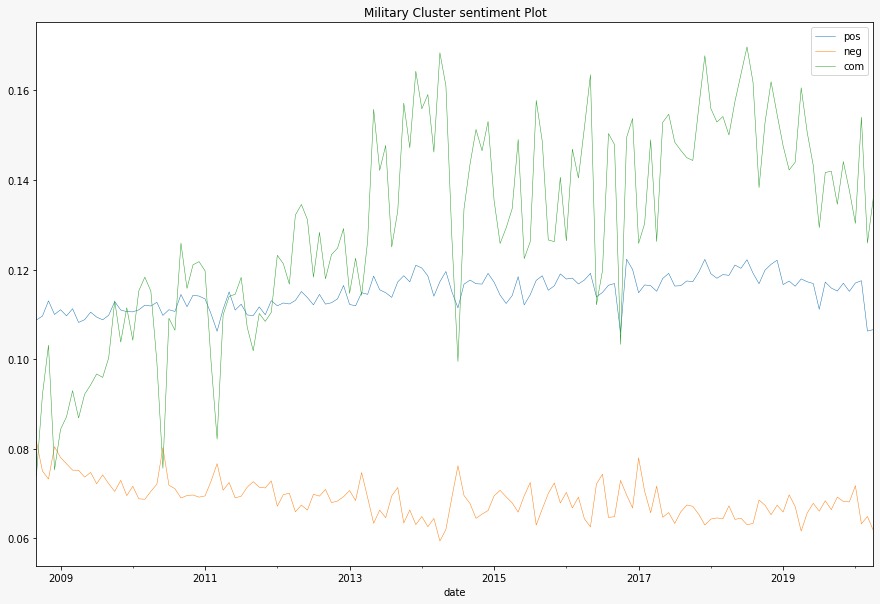
Here, we see a very different plot than the previous ones we studied. The general trend seem to follow a decrease of negativity and an increase of the positivity over the years. While we do not have a clear explanation for this, we can still observe an interesting spike of negativity in the middle of 2014, which happen close to the announcement of the International military intervention against the Islamic State.
Last but (sadly) least, the domain we will focus on is Economy :
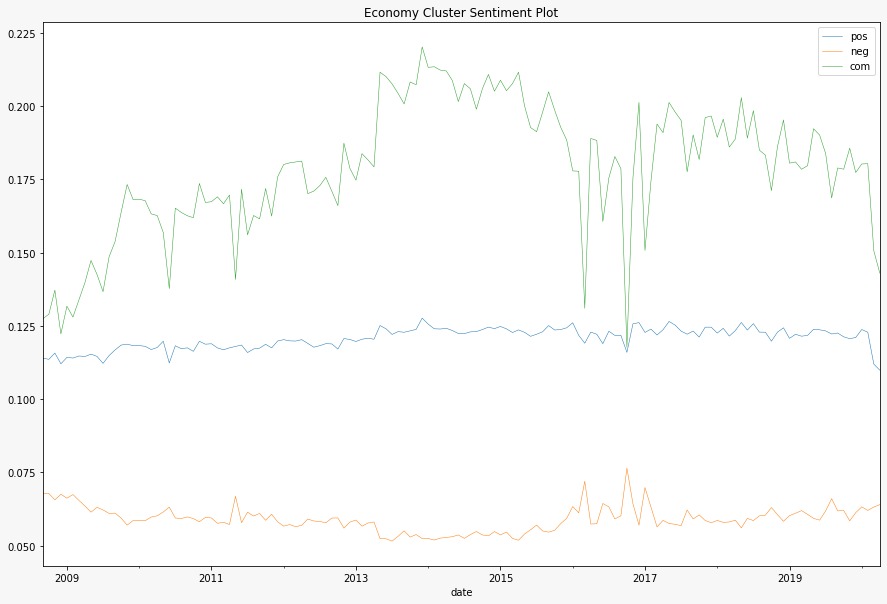
We’re facing the first plot without any significant spikes of sentiment changes other than the ones appearing in 2016. We would have loved to be able to see, for example, the impact of the subprime crisis but it looks like our project is not accurate enough at the current state to observe such events, probably due to the way we assess the sentiment of the quotes.
Role of the occupation
As the last section of this story, let’s take a look at the role of one’s job in assessing his mental state. For this, we begin by comparing the positivity and negativity scores over the years for the 4 clusters studied in the previous chapter.
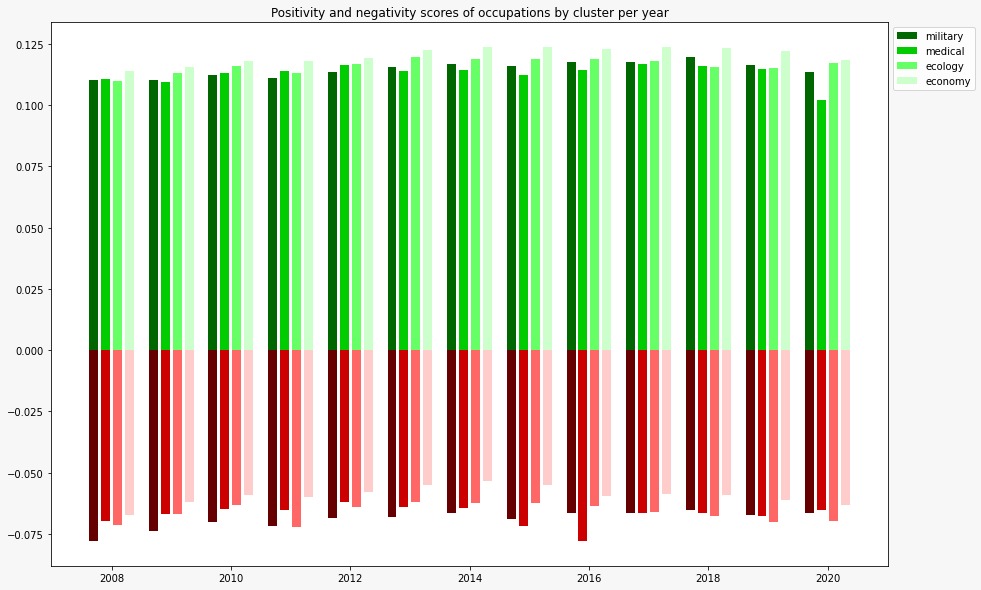
Among the domains, there is a pattern which is that the quotes are more positive than negative overall. Economy seems to be the clear most positive having the best scores every year as well as expressing less negativity. The 3 others are close for both categories, with the exception of one huge spike in negativity for the medical field in 2016, which has already been observed but may be, as we explained, due to the inconsistency of the data.
Let’s move on the compound scores for the same clusters, to have a better insight of the overall sentiment over the years.
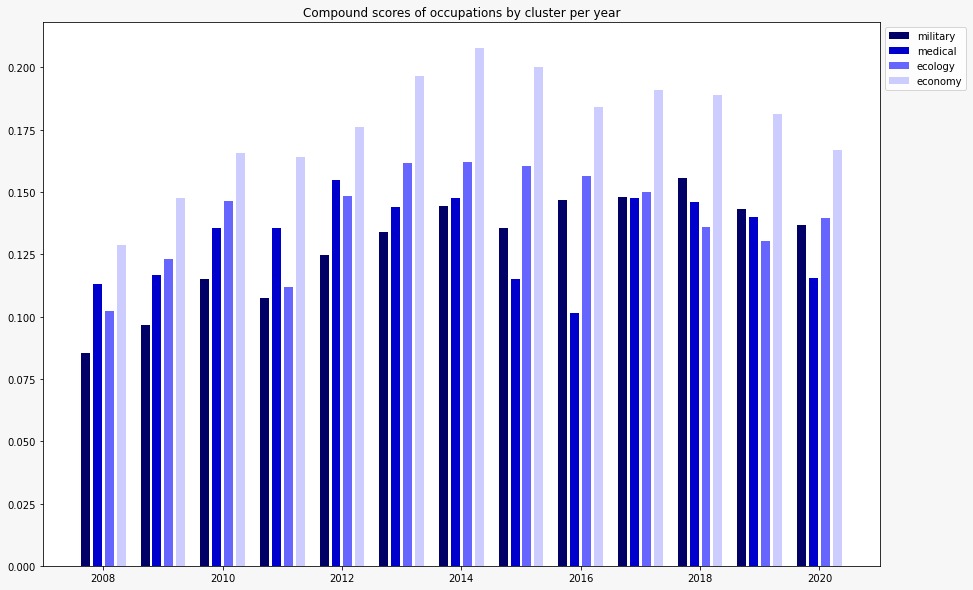
As expected, the economy domain once again stands out by being the most positive. From 2008 to 2014 we see an increase of the score for each field, that lowers down slowly afterwards. Again, there is an exception for the medical workers which, as we mentionned beforehand, may not be signicative but we can observe that the increase of negative may already be seen in 2015.
Conclusion
Using data analysis, we were able to study the sentiment of a population over a period of time and the impact an event or the situation of the speaker may have. Depsite facing some problems working with the data, we still managed to cover a wide pannel of thematics and to get a great insight of what quotes and background of the people behind them can show of the history of humankind.